To say 2023 was challenging may be an understatement. While stocks had a surprisingly impressive year, there was no shortage of obstacles for investors to overcome, including historic interest rate volatility, recession risk, banking sector turmoil, and a game of monetary policy chicken played between the markets and the Federal Reserve (Fed). LPL Research had some wins and some losses as the market delivered its usual dose of humility to us and many market participants. In an effort to maintain accountability and learn from our mistakes (and hopefully not repeat them), we are starting the new year with our traditional lessons learned commentary.
Lessons Learned: Sometimes “This Time Is Different”
While they may be the four most dangerous words in investing, the use of ‘this time is different’ has never been more widespread than in the post-pandemic economy. An inverted yield curve, continued deterioration in leading economic indicators, and the lagged effects from one of the most aggressive rate-hiking cycles in history all pointed toward a recession in 2023. This was our base-case forecast for 2023, further supported by evidence of the consumer sector retrenching after years of inflationary pressures, rising housing costs, and slowing real wage growth. However, as we learned along with the rest of the consensus calling for a recession, sometimes this time is different. The economy grew faster than expected, unemployment remained historically low, and services spending flourished despite a backdrop of multi-year high interest rates. We were particularly surprised by the strength of the American consumer last year, although we remain concerned about the sustainability of spending as excess savings become depleted and delinquency rates for credit card debt and auto loans rise.
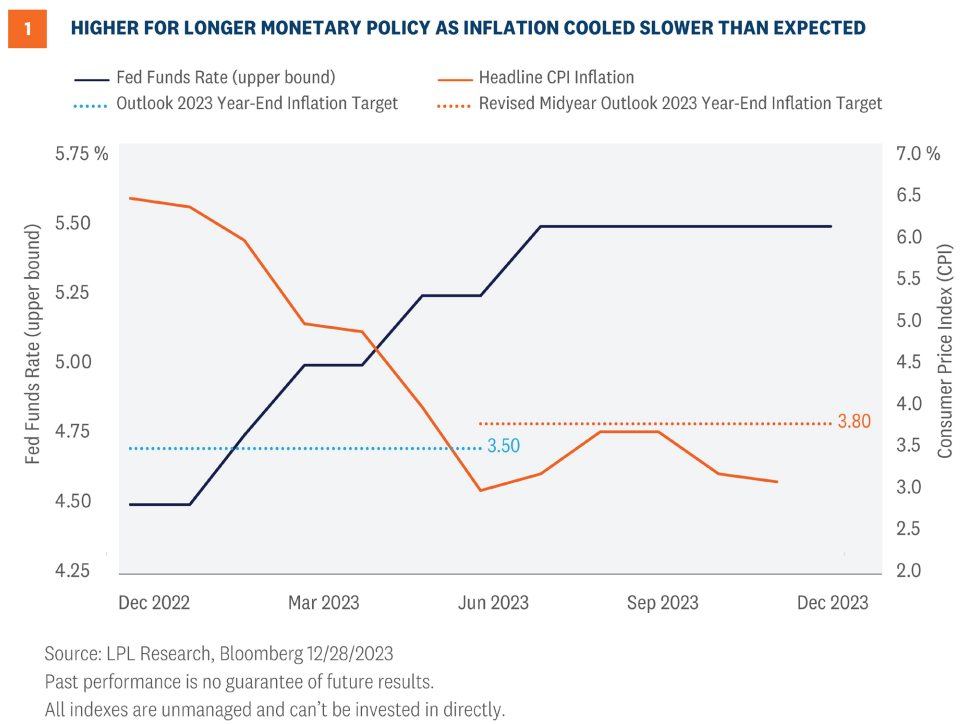
Perhaps most importantly, and a call we got right last year, inflation decelerated to the point where the Fed was comfortable pausing its rate-hiking campaign (Figure 1). However, the trajectory of cooling inflation last year was a bit slower than expected, primarily due to sticky services sector inflation propped up by shelter costs. As we highlighted in our 2023 Outlook, and a theme we discussed throughout last year, the proliferation of multi-family units being built would eventually bring down rental rates and support a lower Consumer Price Index (CPI). As of November 2023, the shelter component of CPI had dropped to its lowest level since September 2022.
Lessons Learned: Don’t Stop Believing
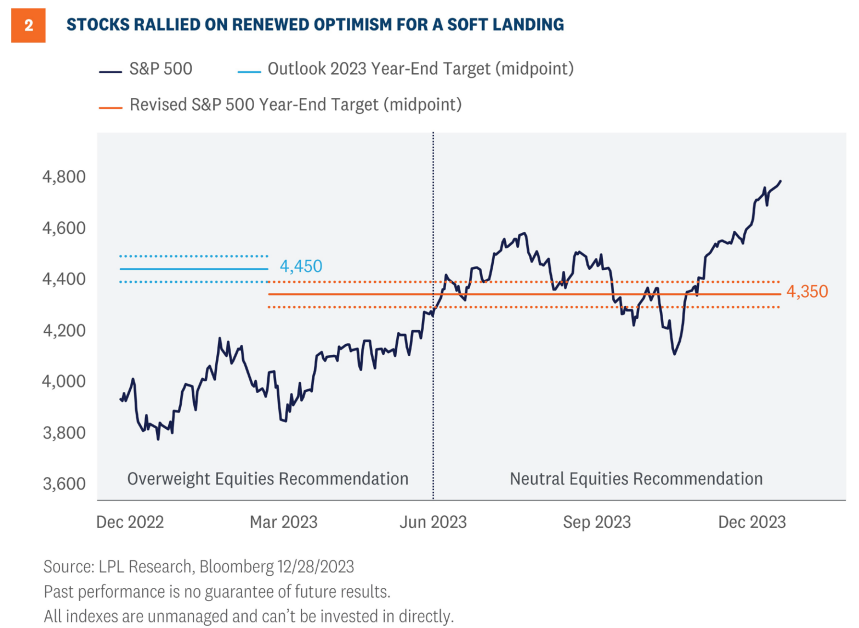
If the market had a theme song for 2023, it would have to be Journey’s “Don’t Stop Believing.” We believed in the prospect of a bull market in 2023 and penciled in a fair value forecast range of 4,400–4,500 and index earnings of $220 (Figure 2). Our rationale was predicated on falling interest rates and lower inflation supporting higher stock valuations while noting additional upside potential if the outlook for a soft landing improved. Our original price target was reached this summer, and S&P 500 earnings for 2023 are expected to be at $218, according to Bloomberg estimates.
There is nothing like a banking crisis to instill fear in the market. The unexpected shuttering of Silicon Valley Bank (SVB) in March, followed closely by the closures of Signature Bank (SBNY) and First Republic Bank (FRB), sparked flashbacks of the Global Financial Crisis and created widespread concern over systemic risk. The S&P 500 responded by dropping roughly 9% from its February high until finally finding support near 3,800.
Going into March, the market also faced higher-than-expected inflation readings and rising rate hike expectations. Based on this backdrop, we slightly lowered our year-end S&P 500 fair value target to 4,300–4,400 in March. However, despite the increased uncertainty, we stuck with our overweight equity recommendation. We also took advantage of the selloff in the banking sector by upgrading our view on preferred securities to positive from neutral in April.
Stocks recovered quickly as investors became more comfortable with the banking sector risk being more idiosyncratic than systemic. The soft-landing narrative also gained traction, and the S&P 500 promptly climbed to key resistance at 4,200 by June. At this time, technology was overbought, market leadership was particularly narrow, and valuations appeared full, given the economic backdrop. As a result, we lowered our outlook on equities to neutral from overweight and simultaneously upgraded our view on fixed income to positive from neutral, recommending investors take advantage of increasingly attractive yields via high-quality fixed income. While neutral on equities is not negative, and the rating changes allowed us to move fixed income to positive, we nonetheless learned our lesson to channel our inner Journey and “hold onto that feeling” to keep believing in this bull market. We also had some other notable wins with our upgrade of large caps to positive from neutral in May and our consistent underweight recommendation to emerging markets.
Lessons Learned: Don’t Fight The Fed
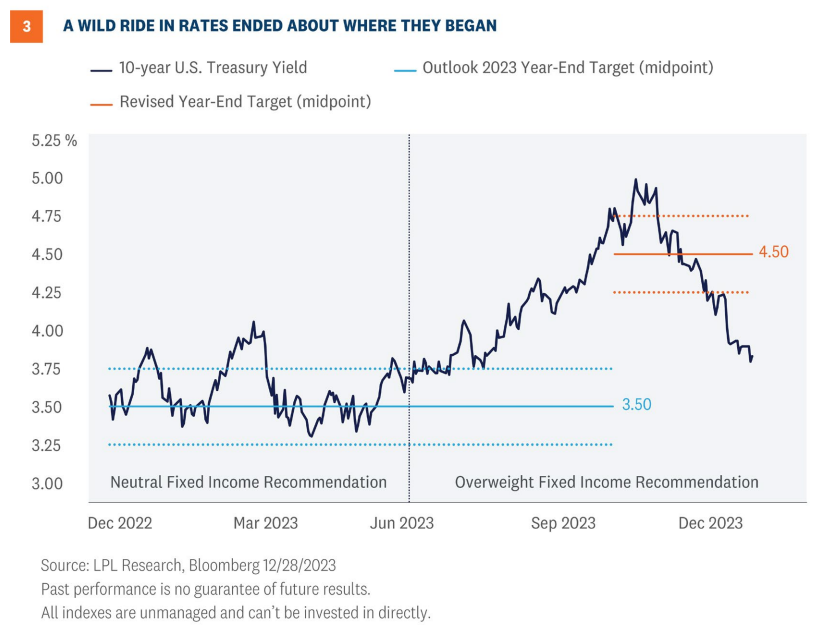
While ‘don’t fight the Fed’ is usually a term reserved for equity investors, it was more applicable to the fixed income market in 2023. Throughout the year, the Fed stuck to a hawkish script and reiterated there was “more work to do” on tackling inflation. The fixed income market mostly ignored the Fed’s messaging and prematurely priced in a peak terminal rate along with interest rate cuts as early as 2023.
And while we underestimated the resiliency of the U.S. economy, we did outline in our 2023 Outlook that “the path of interest rates will certainly be largely influenced by the Fed’s behavior, which will be guided by economic growth and inflation data.” So, as the economy continued to exceed expectations, interest rates went up by more than anticipated, and the chances for a recession went down, which in turn led the Fed to stick to its “higher for longer” approach—rather than lowering rates to stave off a looming recession.
Our initial forecast was for 10-year yields to finish 2023 within a range of 3.25%–3.75% (Figure 3), not far from the December 29 close of 3.88% and where yields began the year. However, due to historic market volatility this fall, including a jump to 5% on 10-year yields, we revised our year-end 2023 target range to 4.25%–4.75% in October. Since then, rates have tumbled on the back of rising expectations for a Fed transition from rate hikes to rate cuts in 2024. What was surprising at the last Federal Open Market Committee (FOMC) meeting, and a key catalyst for the drop in rates and subsequent equity market rally, was that the Fed finally came down closer to market expectations for interest rate cuts versus the market being forced to recalibrate expectations higher. However, the gap between Fed projections and market expectations for monetary policy still remains high.
Investment Conclusion
As we look ahead to 2024, our year-end fair value target range for the S&P 500 is 4,850–4,950. That range is based on 1) a price-to-earnings ratio (P/E) of 19.5, in line with the five-year average, and 2) our projected 2025 S&P 500 earnings per share (EPS) of $250, just 6% above our 2024 earnings estimate.
The strong rally since our 2024 Outlook was published leaves only about 2–3% upside for the S&P 500 next year (excluding dividends). These returns are not particularly compelling compared to potential returns from fixed income, which carries less risk. However, we see potential upside above 5,000 if lower interest rates support higher valuations and the U.S. economy avoids recession in 2024, which could enable double-digit earnings growth, as currently reflected in consensus estimates.
LPL’s Strategic and Tactical Asset Allocation Committee (STAAC) recommends a neutral tactical allocation to equities, with a modest overweight to fixed income funded from cash. The risk-reward trade-off between stocks and bonds still looks relatively balanced to us even after the strong two-month rally, with core bonds providing a yield advantage over cash. Favorable seasonality may carry this momentum into January, but we would look for market volatility to pick up a bit at some point during the first quarter as an economic slowdown comes into view and the bond rally potentially runs out of gas.
The STAAC recommends large cap growth style equities over their large cap value counterparts. The STAAC believes growth style large-cap equities may benefit from lower inflation and stabilization of interest rates in the intermediate term. Growth stocks may also benefit from superior earnings prospects against a backdrop of a slowing economy.
Within fixed income, the STAAC recommends an up-in-quality approach with benchmark-level interest rate sensitivity. We think core bond sectors (U.S. Treasuries, agency mortgage-backed securities (MBS), and short-to-intermediate maturity investment grade corporates) are currently more attractive than plus sectors (high-yield bonds and non-U.S. sectors), with the exception of preferred securities, which look attractive after having sold off this spring due to stresses in the banking system.
IMPORTANT DISCLOSURES
This material is for general information only and is not intended to provide specific advice or recommendations for any individual. There is no assurance that the views or strategies discussed are suitable for all investors or will yield positive outcomes. Investing involves risks including possible loss of principal. Any economic forecasts set forth may not develop as predicted and are subject to change.
References to markets, asset classes, and sectors are generally regarding the corresponding market index. Indexes are unmanaged statistical composites and cannot be invested into directly. Index performance is not indicative of the performance of any investment and do not reflect fees, expenses, or sales charges. All performance referenced is historical and is no guarantee of future results.
Any company names noted herein are for educational purposes only and not an indication of trading intent or a solicitation of their products or services. LPL Financial doesn’t provide research on individual equities.
All information is believed to be from reliable sources; however, LPL Financial makes no representation as to its completeness or accuracy.
US Treasuries may be considered “safe haven” investments but do carry some degree of risk including interest rate, credit, and market risk. Bonds are subject to market and interest rate risk if sold prior to maturity. Bond values will decline as interest rates rise and bonds are subject to availability and change in price.
The Standard & Poor’s 500 Index (S&P500) is a capitalization-weighted index of 500 stocks designed to measure performance of the broad domestic economy through changes in the aggregate market value of 500 stocks representing all major industries.
The PE ratio (price-to-earnings ratio) is a measure of the price paid for a share relative to the annual net income or profit earned by the firm per share. It is a financial ratio used for valuation: a higher PE ratio means that investors are paying more for each unit of net income, so the stock is more expensive compared to one with lower PE ratio.
Earnings per share (EPS) is the portion of a company’s profit allocated to each outstanding share of common stock. EPS serves as an indicator of a company’s profitability. Earnings per share is generally considered to be the single most important variable in determining a share’s price. It is also a major component used to calculate the price-to-earnings valuation ratio.
All index data from FactSet.
Value investments can perform differently from the market as a whole. They can remain undervalued by the market for long periods of time.
The prices of small cap stocks are generally more volatile than large cap stocks.
International investing involves special risks such as currency fluctuation and political instability and may not be suitable for all investors. These risks are often heightened for investments in emerging markets.
LPL Financial does not provide investment banking services and does not engage in initial public offerings or merger and acquisition activities.
This research material has been prepared by LPL Financial LLC.
Securities and advisory services offered through LPL Financial (LPL), a registered investment advisor and broker-dealer (member FINRA/SIPC). Insurance products are offered through LPL or its licensed affiliates. To the extent you are receiving investment advice from a separately registered independent investment advisor that is not an LPL affiliate, please note LPL makes no representation with respect to such entity.
Not Insured by FDIC/NCUA or Any Other Government Agency | Not Bank/Credit Union Guaranteed | Not Bank/Credit Union Deposits or Obligations | May Lose Value
RES-000524-1223 | For Public Use | Tracking #522054 (Exp. 12/2024)
For a list of descriptions of the indexes referenced in this publication, please visit our website at lplresearch.com/definitions.
