The winning streak for stocks continued in August, as the S&P 500 posted its fourth consecutive month of gains. It was an informative month for investors, as we learned that the labor market may not be as solid as expected, tariffs have had a minimal impact on inflation and margins thus far, corporate America and the consumer remain resilient, and the Federal Reserve (Fed) is likely ready to cut rates later this month. This backdrop propelled the broader market up nearly 2% last month and to its 20th record high of the year on Thursday. Friday’s inflation report revealed that consumer spending rose in July despite a slight acceleration in the year-over-year core Personal Consumption Expenditures (PCE) Price Index — the Fed’s preferred inflation gauge. The mostly in-line report had a minimal impact on rate cut expectations, with the fed funds futures market implying nearly a 90% probability for a 0.25% rate cut this month. However, the upcoming payrolls report on Friday could move the needle; anything hot on payroll gains could throw some cold water on rate cut estimates.
So Long Sweet Summer
The end of Labor Day weekend often arrives with a bittersweet tone — it’s a final salute to summer’s warmth and leisure before the cool air of fall arrives for much of the country. Across the U.S., Americans have begun to trade beach days and backyard barbecues for football games and fall festivals. This seasonal pivot mirrors the stock market’s own transition from a remarkably steady summer, characterized by low volatility, record highs, and a resilient recovery since April, to a potentially cooling-off period. As the calendar has now officially turned to September, investors face a landscape clouded by uncertainty surrounding tariffs, inflation pressures, labor market dynamics, and evolving monetary policy, all of which could contribute to elevated volatility and a more colorful backdrop of price action for the broader market.
Seasonal trends should always be viewed with some degree of caution, as they reflect the broader market climate rather than the current market conditions. September, in particular, has a bad reputation for being the weakest month for equities. Over the last 75 years, the S&P 500 has posted an average return of -0.7% in September, making it the worst-performing month for stocks. When September finished in the red, the average loss was -3.8%. This compares to the average gain of 3.2% when stocks finished higher on the month. Furthermore, the S&P 500 has only generated positive returns in September 44% of the time, marking the lowest positivity rate for any month across the calendar.
However, context is key when it comes to seasonal data, and right now, the market is trending higher and exhibiting strong momentum into September. When accounting for these factors, September hasn’t been so bad. For example, when the S&P 500 is above its 200-day moving average (dma) going into September, the average price return for the month jumps to 1.3%, with 60% of occurrences producing positive results. This compares to an average September price decline of 4.2% and positivity rate of only 15% when the index is trading below its 200-dma going into the month.
Finally, there is a silver lining to September weakness. As the saying goes, with volatility comes opportunity, and the October to December time frame has historically provided a steady stream of above-average returns in the equity market. Since 1950, the S&P 500 has generated an average annual gain of 4.2% and finished higher 80% of the time over this period.
S&P 500 September Seasonality Scenarios (1950-YTD)
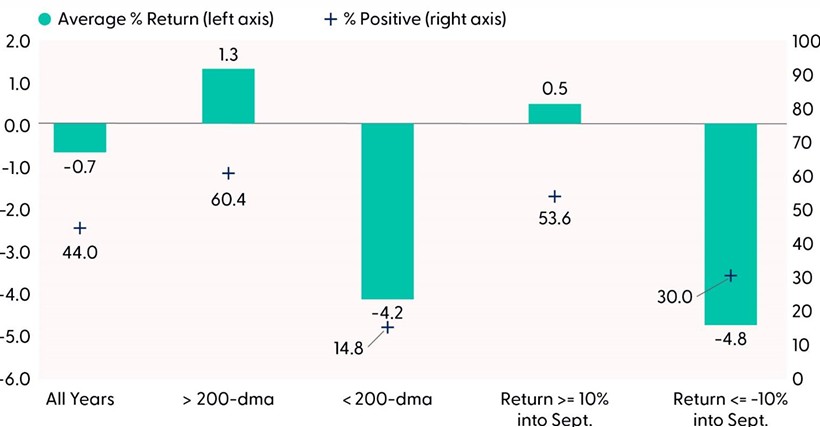
Source: LPL Research, Bloomberg 08/28/25
Disclosures: Past performance is no guarantee of future results. All indexes are unmanaged and can’t be invested in directly. The modern design of the S&P 500 stock index was first launched in 1957. Performance back to 1950 incorporates the performance of the predecessor index, the S&P 90.
Another Solid Earnings Season for the S&P 500
While seasonality may be an ancillary factor influencing market performance, other more powerful macroeconomic forces ultimately drive future equity market performance. And for U.S. equity markets, this is especially important context given the continued earnings growth of the S&P 500. As of August 29, 98% of the index had reported Q2 results, including NVIDIA (NVDA), the star of every earnings season. The poster child of artificial intelligence, which also carries about an 8% weight within the S&P 500 Index (more than the combined weight of the materials, real estate, and utilities sectors), beat earnings and revenue estimates. However, lighter-than-expected data center sales and softness in China resulted in back-to-back losses after the print last week.
For the broader market, earnings per share (EPS) growth for the S&P 500 is expected to reach nearly 12% in Q2, more than double the growth rate anticipated at the start of the quarter. Over 80% of companies beat on the bottom line, with 50 companies also issuing positive guidance (both metrics are above the five and 10-year averages). The positive earnings backdrop underpinned a lot of upward earnings revisions to EPS estimates. In fact, earnings revision breadth for the S&P 500, measured by the net number of upward EPS estimate revisions minus downward revisions, divided by the total number of index members, climbed to its highest level since August 2021 last month. This not only reflects an improving outlook for U.S. equities but also helps justify the rally in stocks (note the positive relationship between revision breadth and rolling three-month S&P 500 performance in the “Earnings Revisions Breadth is Also Improving” chart) and pushes back against the notion of the market being in a bubble.
Earnings Revisions Breadth is Also Improving
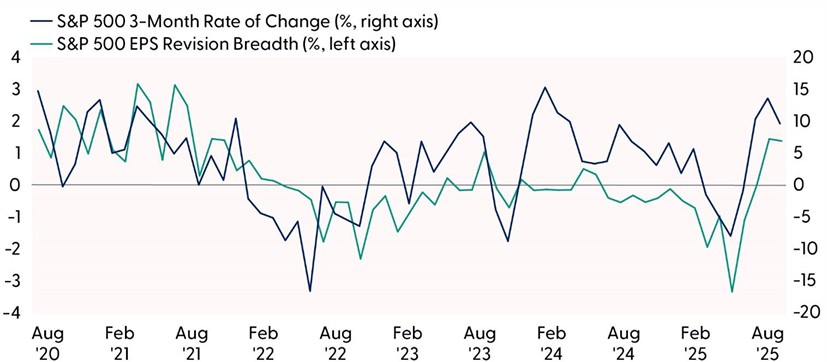
Earnings revision breadth measures the net number of upward EPS estimate revisions minus downward revisions, divided by the total number of index members, for each one-month window.
Source: LPL Research, Bloomberg 08/28/25
Disclosures: Past performance is no guarantee of future results. All indexes are unmanaged and can’t be invested in directly.
Rotation Revival
Earnings revisions are not the only thing broadening out. Last month marked an important rotation for the S&P 500 as the record-high rally expanded beyond the borders of big tech. A notable unwind of crowded positioning in high momentum and high-beta names led to flows pouring into other sectors and down market cap. For the S&P 500, this meant expanding breadth metrics and a new all-time high for the equal-weight S&P 500, a proxy for the “average” large cap stock. For small caps, new buyers emerged that drove the S&P 600 Small Cap Index up roughly 7% in August, marking its best month of outperformance over the S&P 500 in over a year.
Technically, the S&P 600 also made a lot of progress as the index reversed a downtrend and cleared resistance off the July highs. Building momentum in the developing uptrend was further validated by a golden cross, defined by the 50-day moving average (dma) crossing back above the 200-dma for the first time since December 2023. The rally in small caps has caught many off guard — and on the wrong side of the trade for many speculators in the hedge fund space. According to data from the Commodity Futures Trading Commission (CFTC), non-commercial short positions in the small-cap focused Russell 2000 Index recently reached their highest level since 2022. With trend and momentum remaining bullish, the prospect for a short-covering rally tailwind for small caps remains high.
As exciting as the recent price action in small caps has been, we remain respectful of the longer-term trend of large cap outperformance. The bottom panel of the “Call it a Comeback for Small Caps” chart compares the S&P 600 to the S&P 500. Despite some fits and starts to small cap relative strength over the years, the ratio chart remains in a well-defined downtrend. And until this trend is reversed, we remain skeptical of sustainable small cap outperformance on a longer-term basis, although we are open-minded to a shorter-term catch-up rally in the space.
Call it a Comeback for Small Caps
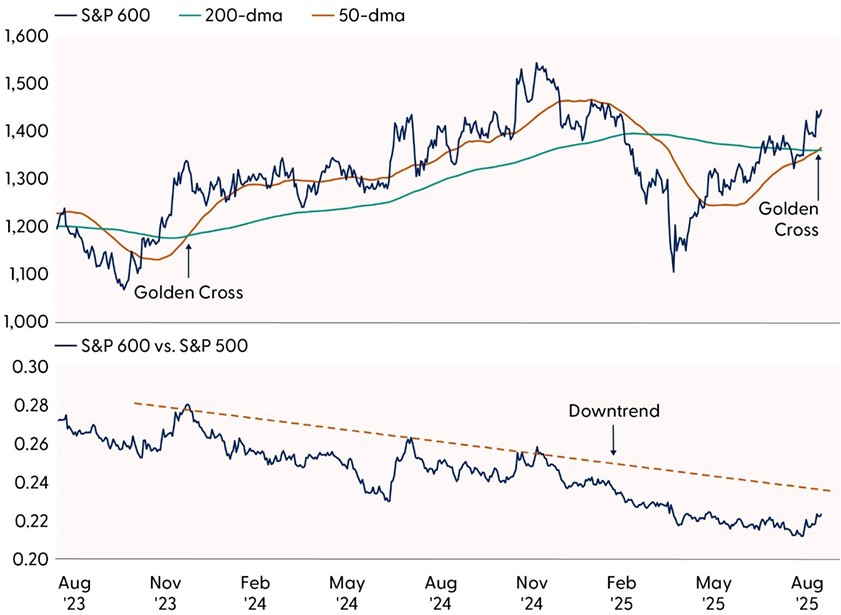
Source: LPL Research, Bloomberg 08/28/25
Disclosures: Past performance is no guarantee of future results. All indexes are unmanaged and can’t be invested in directly.
Summary
September could live up to its reputation of being turbulent for stocks. However, history has shown that when the broader market is trending higher into the month, seasonal weakness has not necessarily been a factor. Continued double-digit earnings growth and broadening upward EPS revisions further add to the evidence of a bull market on solid footing. And if the market does suffer a drawdown this month, seasonal headwinds historically turn into tailwinds in October, which could be further boosted by a rate cut later this month. Finally, while seasonality may be an ancillary factor influencing market performance, other more powerful macroeconomic forces, such as the health of the overall economy and corporate America, ultimately drive future equity market performance.
Asset Allocation Insights
LPL’s Strategic and Tactical Asset Allocation Committee (STAAC) maintains its tactical neutral stance on equities. Investors may be well served by bracing for occasional bouts of volatility given how much optimism is reflected in stock valuations, lingering tariff and inflation risks, and historical seasonal weakness. LPL Research advises against increasing portfolio risk beyond benchmark targets currently and continues to monitor trade negotiations, economic data, earnings, the bond market, and various technical indicators to identify a potentially more attractive entry point to potentially add equities on weakness.
The STAAC’s regional preferences across the U.S, developed international, and emerging markets (EM) are aligned with benchmarks. The Committee still favors growth over value, large caps over small caps, and the communication services and financials sectors.
Within fixed income, the STAAC holds a neutral weight in core bonds, with a slight preference for mortgage-backed securities (MBS) over investment-grade corporates. The Committee believes the risk-reward for core bond sectors (U.S. Treasury, agency MBS, investment-grade corporates) is more attractive than plus sectors. The Committee does not believe adding duration (interest rate sensitivity) at current levels is attractive and remains neutral relative to benchmarks.
Important Disclosures
This material is for general information only and is not intended to provide specific advice or recommendations for any individual. There is no assurance that the views or strategies discussed are suitable for all investors or will yield positive outcomes. Investing involves risks including possible loss of principal. Any economic forecasts set forth may not develop as predicted and are subject to change.
References to markets, asset classes, and sectors are generally regarding the corresponding market index. Indexes are unmanaged statistical composites and cannot be invested into directly. Index performance is not indicative of the performance of any investment and do not reflect fees, expenses, or sales charges. All performance referenced is historical and is no guarantee of future results.
Any company names noted herein are for educational purposes only and not an indication of trading intent or a solicitation of their products or services. LPL Financial doesn’t provide research on individual equities.
All information is believed to be from reliable sources; however, LPL Financial makes no representation as to its completeness or accuracy.
All investing involves risk, including possible loss of principal.
U.S. Treasuries may be considered “safe haven” investments but do carry some degree of risk including interest rate, credit, and market risk. Bonds are subject to market and interest rate risk if sold prior to maturity. Bond values will decline as interest rates rise and bonds are subject to availability and change in price.
The Standard & Poor’s 500 Index (S&P500) is a capitalization-weighted index of 500 stocks designed to measure performance of the broad domestic economy through changes in the aggregate market value of 500 stocks representing all major industries.
The PE ratio (price-to-earnings ratio) is a measure of the price paid for a share relative to the annual net income or profit earned by the firm per share. It is a financial ratio used for valuation: a higher PE ratio means that investors are paying more for each unit of net income, so the stock is more expensive compared to one with lower PE ratio.
Earnings per share (EPS) is the portion of a company’s profit allocated to each outstanding share of common stock. EPS serves as an indicator of a company’s profitability. Earnings per share is generally considered to be the single most important variable in determining a share’s price. It is also a major component used to calculate the price-to-earnings valuation ratio.
All index data from FactSet or Bloomberg.
This research material has been prepared by LPL Financial LLC.
Not Insured by FDIC/NCUA or Any Other Government Agency | Not Bank/Credit Union Guaranteed | Not Bank/Credit Union Deposits or Obligations | May Lose Value
For public use.
Member FINRA/SIPC.
RES-0005819-0825 Tracking #790279 | #790281 (Exp. 09/26)
