Dividend strategies, a.k.a. equity income strategies, have outperformed to start the year, owing to the value-led cyclical rotation we are seeing in domestic equity markets. Looking beyond current performance, this week, we ask and answer the question “How should I think about dividend stocks or building an equity income portfolio?”
Executive Summary
The idea of lying on the beach while your money works for you is often idealized in the financial media and by financial professionals alike. And why not? Investors love passive income, whether it comes from interest payments via fixed income securities, rental income from a real estate investment, or dividends from a stock portfolio. Our focus is on dividends, and understanding different approaches investors can incorporate into equity allocations. In this week’s Weekly Market Commentary, we analyze different equity income strategies, explain why we believe incorporating quality makes sense, and review technical charts to understand what’s potentially on the horizon for the near-term performance of different equity income strategies.
Key Takeaways
-
Look Beyond Simple Dividend Yields. Our research shows that building a systematic dividend income strategy based solely on high dividend yields underperforms strategies based on total shareholder yield (dividend + buyback yield) or dividend growth.
-
Pay Attention to Price-Based Returns. When analyzing equity income strategies, it is important to consider both sources of total return: current income and price-based returns (i.e., capital appreciation). Myopically focusing on total return ignores many real-world considerations like taxes, transaction costs, and current income requirements.
-
Keep Quality Front of Mind. Given the susceptibility of high-dividend strategies to unknowingly fall into value- or yield-traps, we suggest “paying up” (i.e., accepting a slightly lower yield) to increase quality in any equity income portfolio, but especially in one focused solely on high dividend yields.
-
What’s Working Today? Dividend-oriented equities remain in strong uptrends, supported by solid momentum and improving relative strength versus the broader market. The simple dividend yield strategy is currently leading on a short term basis, but longer-term relative trends favor continued outperformance from dividend growth and shareholder yield within the dividend stock landscape.
Equity Income: More Than Just Dividend Yields
For many investors, the desire for yield is a bedrock of their portfolio construction strategy. In this pursuit, dividend paying stocks are often chosen for a portfolio’s equity allocation, providing a tangible cash return alongside the potential for capital appreciation. The starting point for most investors when building a portfolio of dividend paying stocks is the dividend yield. It is a straightforward, easily calculated figure that provides a framework for stock selection. Simply choose among the highest dividend yields to generate the highest level of income relative to capital invested. This dividend yield approach serves as a baseline strategy for comparison.
We propose an alternative framework for building or selecting an equity income portfolio, built around two enhanced strategies. The first is dividend growth, which shifts the focus from the level of the dividend today to the durability and consistent growth of the dividend over time. The second is shareholder yield, a more comprehensive metric that captures the total capital returned to shareholders by combining dividends with net share buybacks.
There is empirical evidence, by way of established third-party equity indexes, that enhanced equity income strategies such as these have generated compelling returns relative to simple high dividend yield strategies. Indexes that follow a shareholder yield index, such as the Morningstar U.S. Dividend and Buyback Index and those that follow a dividend growth index, like the S&P U.S. Dividend Growers Index have generated higher total return (inclusive of reinvested dividends) as well as higher capital appreciation (measured by cumulative price returns) than a basic high dividend yield index like the S&P 500 High Dividend Index.
Historical Total Returns Are Compelling for Enhanced Dividend Strategies
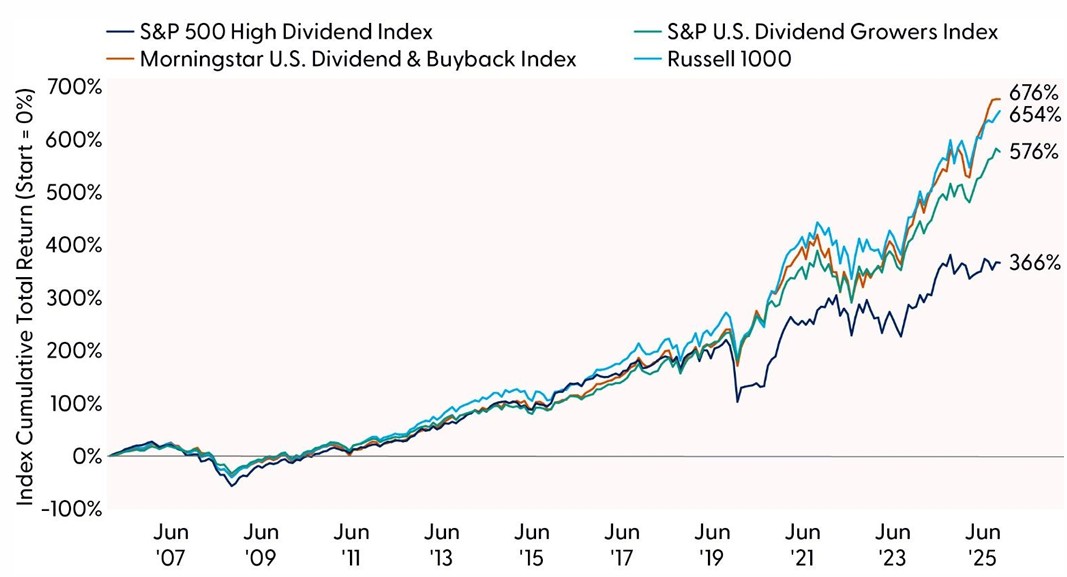
Source: LPL Research, Bloomberg, 12/31/2025; Monthly Cumulative Total Returns (June 2006–December 2025)
Disclosures: All indexes are unmanaged and cannot be invested in directly. Past performance is no guarantee of future results.
Price-Based Returns Have Driven Dispersion Among Equity Income Strategies
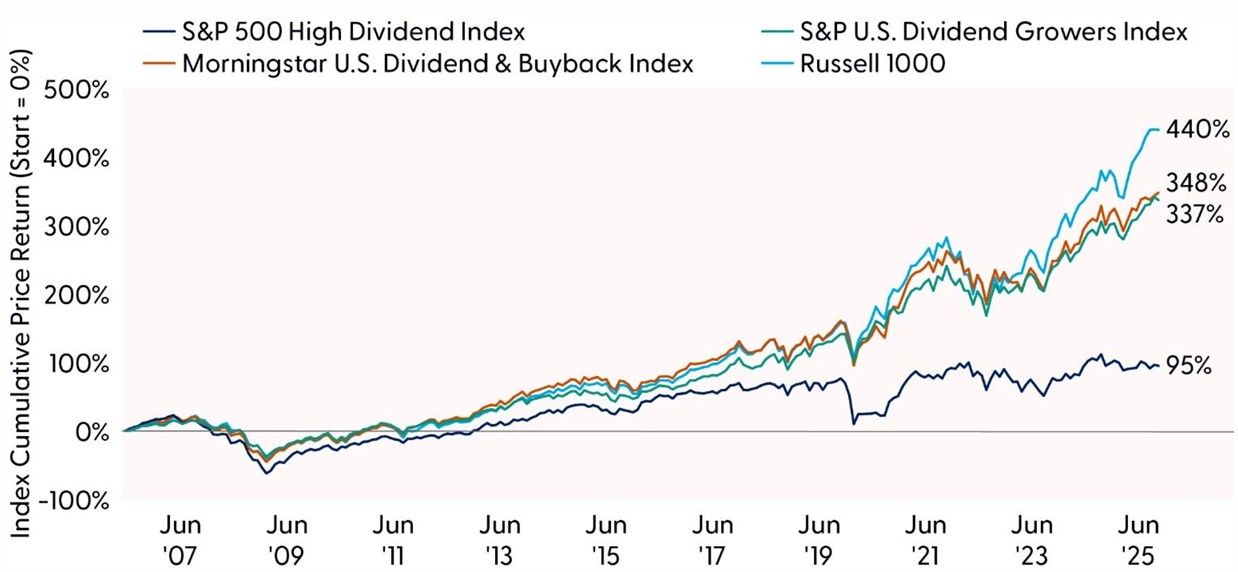
Source: LPL Research, Bloomberg, 12/31/2025; Monthly Cumulative Price Returns (June 2006–December 2025)
Disclosures: All indexes are unmanaged and cannot be invested in directly. Past performance is no guarantee of future results.
As we previously wrote (Exploring Equity Income: Mapping Key Approaches), the underperformance of high dividend payers have several possible explanations, with the simplest being that the high dividend payers are potentially allocating too much capital to cash dividends and not enough to reinvesting in the growth of the business. There are tradeoffs, however, as the high dividend yield index has a current yield that is 80% higher than the shareholder yield index, 2x higher than the dividend growth index, and 3.3x higher than the broad market (measured by the Russell 1000 Index).
Capital Appreciation Tradeoff: High-Dividend Strategies Provide Higher Current Income
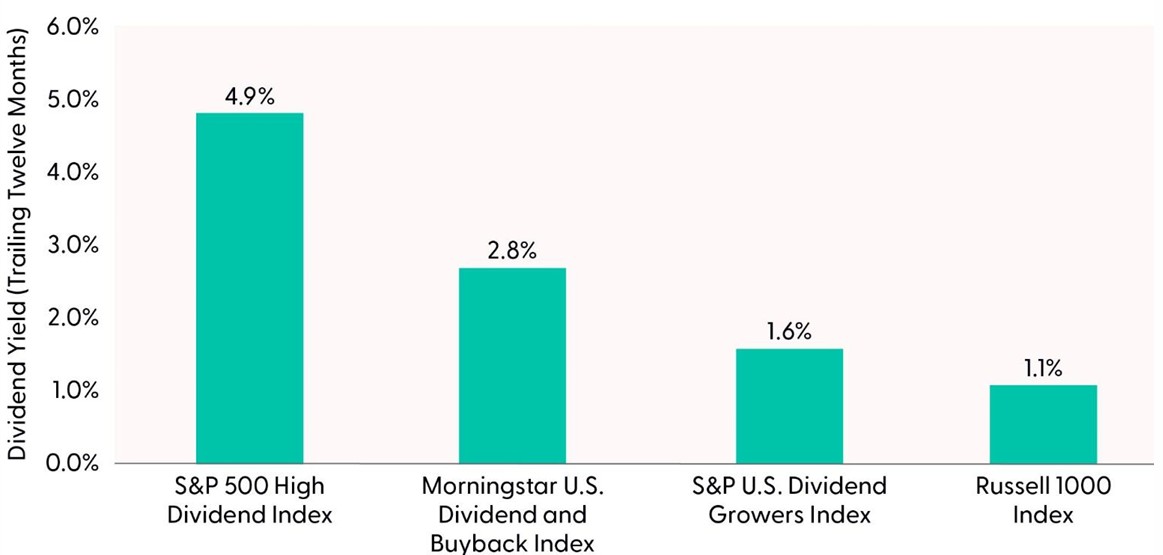
Source: LPL Research, Bloomberg, 12/31/2025; Index Level Dividend Yield (As of 12/31/2025)
Disclosures: All indexes are unmanaged and cannot be invested in directly. Past performance is no guarantee of future results.
In the following sections, we will dig into the underlying structure of these approaches, including the economic rationale for each (the what), attempt to understand the drivers of historical performance (the what happened and why), and review of the current technical setups of the three indicative indexes to shed light on recent price trends (the what’s happening now).
A Framework for Analyzing Equity Income Strategies
We begin by defining our three core dividend strategies and their representative indexes: dividend yield (S&P 500 High Dividend Index), dividend growth (S&P U.S. Dividend Growers Index), and shareholder yield (Morningstar U.S. Dividend and Buyback Index). We will dive deeper into the economic rationale for why we believe the enhanced equity income strategies have outperformed historically, and then explain why we believe that integrating quality may improve any of the core equity income strategies.
The “Control” Strategy: Dividend Yield
The simplest approach, and our core “control” strategy, is dividend yield. This method of generating equity income starts and ends simply by screening a universe of stocks for the highest dividend yield and buying them. The appeal lies in its simplicity and its maximalist approach to generating current income.
However, this simple approach is fraught with hidden risks and flawed assumptions. First off, the strategy is agnostic to the sustainability of the dividend or the health of the underlying business. When a declining share price is driving a dividend yield higher, investors will need to understand whether the declining share price represents a temporary dislocation, or a structural impairment in the fundamentals of the business. Conversely, a high dividend payout ratio driving a stock’s dividend yield higher could prove unsustainable and lead to a dividend cut or suspension. The cumulative price-based performance of the dividend yield strategy relative to the enhanced equity income strategies highlights this risk and is representative of a key finding in our research, namely it suggests that the dividend yield strategy is a “capital treadmill”, i.e., its high dividend comes at the cost of a stagnant capital base.
The “GARP” Approach: Dividend Growth
The dividend growth strategy is a growth-ier approach to equity income, better suited for growth-oriented investors. This strategy prioritizes a company’s ability to consistently grow earnings and free cash flow, and therefore its ability to increase its dividend, rather than the level of its current dividend yield. The underlying assumption is that a steadily growing dividend is one of the strongest indicators of a healthy, high-quality business. Our belief is that a company must possess a durable competitive advantage, disciplined management, and confidence in its future earnings to commit to increasing its dividend year after year. Additionally, consistent dividend growth would seem to naturally filter out companies with volatile earnings or weak balance sheets. The resulting portfolio would therefore likely be composed of mature “cash cow” companies that are leaders in their respective industries, and thus exhibit not only higher exposure to growth factors but also quality factors such as profitability, earnings stability, and solvency.
Because the focus is on the growth of the dividend, the overall portfolio yield of the strategy is generally lower, but historical performance suggests that the potential capital appreciation is higher. Both insights show up in Price based Returns Have Driven Dispersion Among Equity Income Strategies and Capital Appreciation Tradeoff: High Dividend Strategies Provide Higher Current Income. The upshot is this strategy may produce high “cost-based dividend yields” within the portfolio (using cost-basis, as opposed to current price, as the denominator in the dividend yield calculation). This approach is best characterized as a “Growth at a Reasonable Price” (i.e., “GARP”) strategy.
The “Quality Value” Approach: Shareholder Yield
A more holistic framework for identifying equities with attractive capital outlays to investors is shareholder yield. This strategy recognizes that dividends are but one method companies leverage to return capital to their owners (i.e., shareholders). Shareholder yield provides a more complete picture by combining two key components: dividends + share buybacks (net of share issuance, thus neutralizing dilutive policies such as share-based compensation). This approach captures the total capital returned to shareholders (what you get) relative to the market capitalization of the company (what you pay). Our belief is that this approach effectively screens for business quality in two ways:
1) Given that boards and management teams generally consider dividends to be “fixed” and share repurchases to be “variable”, summing up the two may provide a better signal of the robustness of the free cash flow used to fund the distributions.
2) Including share repurchases as well as dividend payouts potentially signals a flexible, shareholder-friendly management team that opportunistically increases share repurchases when shares are trading below management’s estimate of intrinsic value.
Note: Our naïve shareholder yield factor cannot accurately account for those potential opportunistic repurchases outlined in point number two. However, our research of two buyback factors (absolutely buyback level and buyback yield) suggests that incorporating yield (i.e., value) captures this phenomenon appropriately over the long term.
At a portfolio level, we would generally expect this approach to produce a slightly lower dividend yield than a simple dividend yield strategy, but a higher yield than the dividend growth strategy (or the market broadly). This expectation is confirmed by the current yields of the representative indexes. Given the above point on management teams propensity to leverage buybacks as the marginal source of shareholder return, we would expect a shareholder yield strategy to have higher free cash flow margins and less leverage, and thus possess a stronger quality profile.
Why We Believe Integrating Quality May Enhance Any Dividend Strategy
It is our belief, based on our factor strategy research, that over the long-term integrating quality factors such as high profitability, low earnings volatility, low leverage, and high ratios of cash earnings to accounting earnings can lead to better risk-adjusted returns. As previously discussed, it is also our belief that the shareholder yield and dividend growth strategies inherently screen higher-quality fundamentals compared to our baseline dividend yield strategy. Therefore, it stands to reason that integrating quality factors may produce better risk-adjusted outcomes for any equity income strategy. For the enhanced strategies, we surmise that increasing the already present quality exposure may result in a less volatile portfolio that generates higher risk-adjusted returns, with the likely tradeoff being lower current dividend yields. Where quality integration may help the most is the core dividend yield strategy.
We highlighted the inherent risks in the simple dividend yield strategy; that (a) a high yield due to a falling share price may signal weakness in the underlying fundamentals of the business or that (b) high dividend payout ratios may starve the business of necessary capital investment to maintain or grow cash-generating activities. Layering in a quality screen may reduce these risks, though at a likely reduction in current dividend yields (similar to the expected experience with the enhanced strategies).
There are multiple ways an investor can accomplish this. Bottoms-up fundamental research on each high dividend yielding stock is one. For the quantitatively inclined, integrated factor scores or factor quantile screens can also be leveraged. The former would entail standardizing the dividend yield factor and a quality composite factor and blending the standardized z-score, using a weighting scheme of your choice (we’d suggest an equal-weight 50/50 split). The latter would involve sequentially screening a universe for the top dividend yield quantile (such as a top 20% quintile, or a decile approach that screens for the 2nd and 3rd top deciles), and then screening it for the top quality factor quantile among that sub-population.
Current Technical Setup: Dividend Stocks Continue to Climb
-
S&P 500 High Dividend Index (dividend yield): The index has seen a sharp acceleration over the past month as declining yields have boosted the relative attractiveness of dividend-oriented stocks. Sector positioning has also been supportive, benefiting from a rotation toward value and away from mega-cap tech and AI-related disruption risks. (Real estate represents roughly 25% of the index and consumer staples about 18%.) From a technical perspective, the index is consolidating within a short-term bullish flag pattern after breaking above resistance at the 2024 highs. A close above 9,445 would confirm a breakout and open the door to a target of 10,175 — approximately 9% above current levels. Relative performance versus the Equal Weight S&P 500 Index has improved notably in recent months, though it remains below a longer-term downtrend. A sustained move above the August 2025 highs on the ratio chart would signal a new uptrend and point to more durable outperformance ahead.
-
S&P 500 U.S. Dividend Growers Index (dividend growth): The index has climbed steadily above a consistent uptrend that has been in place since April 2025. Realized volatility has been exceptionally low, with the index registering a maximum drawdown over this period of only around 3%. Momentum indicators remain bullish, but not overbought, and point to further upside potential. On a relative basis, the S&P 500 U.S. Dividend Growers Index has broken out of a bottom versus the S&P 500, pointing to further runway for outperformance.
-
Morningstar U.S. Dividend and Buyback Index (shareholder yield): The index has continued to set new record highs after breaking out from a year-long base last fall. Recent overbought conditions have normalized as prices pulled back to test uptrend support. Participation has been robust, with 75% of constituents now trading above their 200-day moving average, a 25% improvement since November. Based on the prior consolidation range, a minimum technical upside objective sets up near 5,400, implying roughly 12% of potential upside from current levels. On a relative basis, the Morningstar U.S. Dividend and Buyback Index has reversed its downtrend versus the Morningstar U.S. Market Index and is now at multi-month highs, indicating further potential for outperformance.
Dividend Stocks Continue to Climb
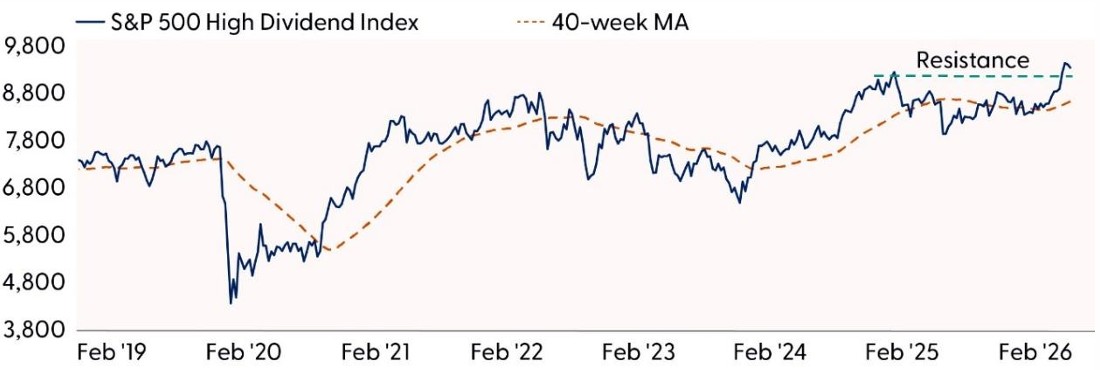
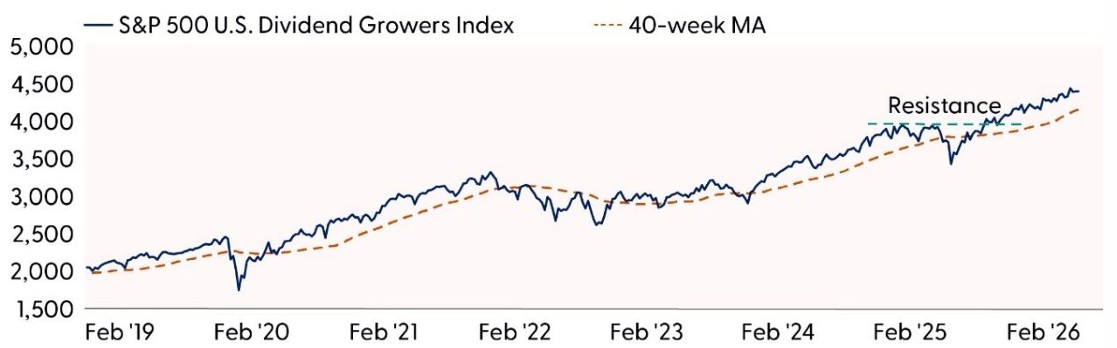
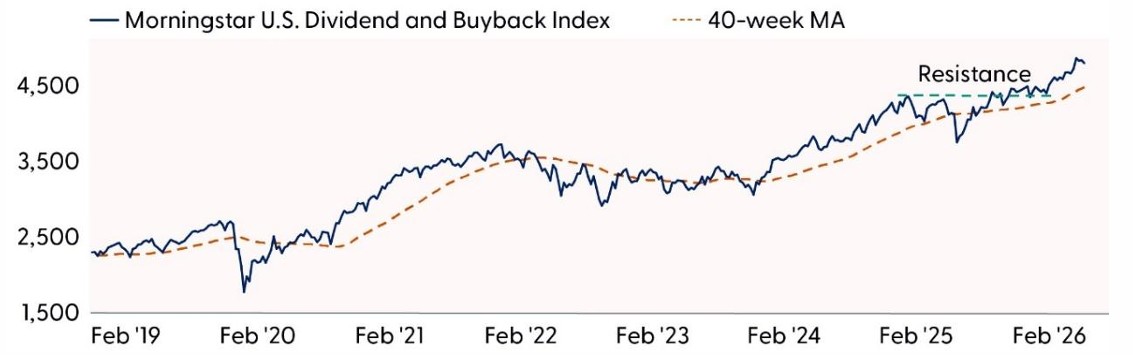
Source: LPL Research, Bloomberg, 02/26/26
Disclosures: All indexes are unmanaged and cannot be invested in directly. Past performance is no guarantee of future results. Estimates may not materialize as predicted and are subject to change.
Conclusion
Our analysis of equity income strategies suggests there is value in a multi‑faceted approach that looks beyond dividend yields. The insights gleaned from this analysis apply to building rules-based screens or systematic “quant” strategies as well as supporting discretionary “quanta‑mental” investment processes, where factor insights inform, but do not replace fundamental judgment. Technical analysis suggests recent outperformance of the basic high dividend strategy may be fleeting and that both of the enhanced equity income strategies show better relative strength.
Looking ahead, the historical results make clear that simple dividend screens may not be adequate for today’s market environment. As capital allocation practices evolve and corporate balance sheets continue to diverge in quality, the opportunity set for equity income investors will increasingly support looking to approaches that go beyond headline dividend yields. A continued shift toward strategies that balance income with capital appreciation (dividend growth), total shareholder return (shareholder yield), and balance‑sheet strength (quality integration) will be essential for generating more resilient outcomes over time.
Important Disclosures
This material is for general information only and is not intended to provide specific advice or recommendations for any individual. There is no assurance that the views or strategies discussed are suitable for all investors or will yield positive outcomes. Investing involves risks including possible loss of principal. Any economic forecasts set forth may not develop as predicted and are subject to change.
References to markets, asset classes, and sectors are generally regarding the corresponding market index. Indexes are unmanaged statistical composites and cannot be invested into directly. Index performance is not indicative of the performance of any investment and do not reflect fees, expenses, or sales charges. All performance referenced is historical and is no guarantee of future results.
Any company names noted herein are for educational purposes only and not an indication of trading intent or a solicitation of their products or services. LPL Financial doesn’t provide research on individual equities.
All information is believed to be from reliable sources; however, LPL Financial makes no representation as to its completeness or accuracy.
All investing involves risk, including possible loss of principal.
Dividend payments are not guaranteed and may be reduced or eliminated at any time by the company.
The Russell 1000 Index consists of the 1,000 largest securities in the Russell 3000 Index, which represents approximately 90% of the total market capitalization of the Russell 3000 Index. It is a large-cap, market-oriented index and is highly correlated with the S&P 500 Index.
The Morningstar US Dividend and Buyback Index is designed to provide exposure to stocks from the Morningstar US Market Index that return capital to shareholders through either dividend payments or share buybacks. The index targets companies representing the higher yielding half of cash distributors from the parent benchmark based on Adjusted Shareholder Yield, which gives 75% weighting to dividend yields and 25% to net buyback yields.
The S&P 500 High Dividend Index serves as a benchmark for income seeking equity investors. The index is designed to measure the performance of 80 high yield companies within the S&P 500 and is equally weighted to best represent the performance of this group, regardless of constituent size.
The S&P U.S. Dividend Growers Index is designed to measure the performance of U.S. companies that have followed a policy of consistently increasing dividends every year for at least 10 consecutive years. The index excludes the top 25% highest-yielding eligible companies from the index.
The Standard & Poor’s 500 Index (S&P500) is a capitalization-weighted index of 500 stocks designed to measure performance of the broad domestic economy through changes in the aggregate market value of 500 stocks representing all major industries.
The PE ratio (price-to-earnings ratio) is a measure of the price paid for a share relative to the annual net income or profit earned by the firm per share. It is a financial ratio used for valuation: a higher PE ratio means that investors are paying more for each unit of net income, so the stock is more expensive compared to one with lower PE ratio.
Earnings per share (EPS) is the portion of a company’s profit allocated to each outstanding share of common stock. EPS serves as an indicator of a company’s profitability. Earnings per share is generally considered to be the single most important variable in determining a share’s price. It is also a major component used to calculate the price-to-earnings valuation ratio.
All index data from FactSet or Bloomberg.
This research material has been prepared by LPL Financial LLC.
Not Insured by FDIC/NCUA or Any Other Government Agency | Not Bank/Credit Union Guaranteed | Not Bank/Credit Union Deposits or Obligations | May Lose Value
For public use.
Member FINRA/SIPC.
RES-0006767-0226 Tracking #1071896 | #1072236 (Exp. 03/27)
